Fatal Police Shooting: is it on the Rise?
What happened in July of 2016?
-
Perhaps you have protested for Alton Sterling’s death or mourned the loss of Philando Castile. July of 2016 is an important month when citizens from all over the United States engaged in a national discourse on the issue of fatal police shooting. Platforms like Twitter are widely used to rally people against the idea that police use excessive force against racial minorities.
people fatally shot by police in 2020
“Michael Brown, 18, was killed by a police officer, in Ferguson, Missouri, who was responding to reports that Brown had stolen a box of cigars.”
“Tamir Rice, a boy of 12, was shot dead in Cleveland, Ohio by a police officer after reports of a male who was “probably a juvenile” pointing a gun that was ‘probably fake’ at passerby.”
“Walter Scott was shot in the back five times by a white police officer.”
“Alton Sterling was killed after police responded to reports of a disturbance outside a shop.”
“Philando Castile was killed while out driving with his girlfriend in St Paul, Minnesota.”
“Stephon Clark died after being shot at least seven times in his grandmother’s backyard in Sacramento, California, by police who were investigating a nearby break-in.”
“Breonna Taylor, a 26-year-old emergency medical technician, was shot 8 times when officers raided her apartment in Louisville, Kentucky.”
“Daunte Wright was shot and killed in Brooklyn Center, just north of Minneapolis.”
“Ma’Khia Bryant, a 16-year-old African-American girl, was fatally shot by police officer Nicholas Reardon in southeast Columbus, Ohio.”
Sadly, stories like these happen more than twice a day on average for the past year, and that is according to the source of our dataset. In reality, the scale of fatal police shooting is bigger than the data can express in this report.
-
Using data to better understand fatal police shooting!
-
Stories are anecdotal evidences that are easily relatable and digestable. But in this article, we take a step back and use data to exmaine the bigger picture of fatal police shooting. This is a “visualized” article. Please see the demo video to learn how to most effectively use our visualizations.
But first things first, good visualizations are built from quality data. Our dataset comes from Kaggle, a data science community with more than 90,000 public datasets. The dataset recorded every fatal police shooting in the United States between 2015-2019. Each victim’s name, date of shooting, age, gender, race, state, and 7 other variables are recorded. These shootings are tracked by culling local news reports, law enforcement websites, social media, and by monitoring independent databases such as Killed by Police and Fatal Encounters. Thus, overall we would say that the data integrity is very high and very usable for our task.
We present the shootings from 2015-2019 in this interactive choropleth map (2020 data removed due to missing data). You can click on each state to dive deeper into the distribution of the shootings in each cities. The stacked barchart visualizes the count of victims belonging to different races. You can also play around with the dropdown manuals to filter gender and manner of death. Feel free to explore the dataset on your own to better understand the distribution of shootings throughout the 50 states.
-
Fatal police shooting rate remains steady, barely influenced by public awareness and attention
-
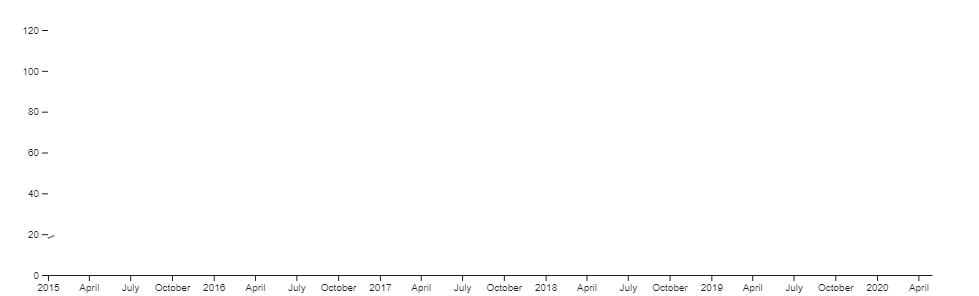
Google search trend is a good representation of public awareness on the topic of fatal police shooting. Essentially, Google ranks the keyword searches by popularity out of a score of 100. The popularity score for “fatal police shooting” spiked up to 100 in July of 2016. This means that during the July 2016, “fatal police shooting” had been the most popular search on google in the United States for an entire month.
Notice that the popularity of “fatal police shooting” rarely drops below 10. News about fatal police shootings have always been circulating the internet. Whenever a news article become viral, people start to protest on the streets, and protests lead to more news coverage. So, “fatal police shooting” gradually snowballs in popularity, and the topic stays relevant throughout the past 5 years.
However, contrary to the hopes of most protestors, public awareness of the issue doesn’t curtail the number of victims shot dead by the polices. By hovering your cursor over the graph above, you can compare the google search popularity with shooting counts at different time stamps. Although “fatal police shooting” became the most popular google search in July of 2016, but the count of victims from fatal police shootings remained consistent throughout the past 5 years.
-
Wyoming might be the most dangerous place to live
-
Police shootings have taken place all across the country. Among them, Wyoming has the highest fatal police shooting rate normalized by 1,000,000 people. Assuming there are a million Americans living in Wyoming, past data would make us believe that 10.58 people will be killed by a police during arrest. New Mexico is ranked second highest shooting rate with 9.54 deaths per million, Oklahoma third with 8.09 deaths per million, Nevada fourth with 6.05 deaths per million, and Louisiana fifth with 5.81 deaths per million. As a comparison, on average, each state in the United States has a rate of 3.27 deaths per million. Though we hypothesize that the high fatal police shooting rate in the top five states is due to poor economy and their closeness to the border. We do not have any evidence supporting these claims. We can, however, circle out the top five states that has more than double the average rate of fatal police shootings, and suggest local police departments spend time investigating the reason behind these statistics.
-
Racial disparity in fatal police shooting keeps increasing
-
Grouped bar chart above shows the change in count of fatal police shootings for each race over the years. Recall earlier that the count of shootings were consistent between 2015-2019, it won’t be a surprised to see that there are almost no differences for Asian, African American, Hispanic, and Native American victim counts over the years. However, what is surprising is that the gradual decline in White non-Hispanic victim counts. The number of White victims over the years dropped from 497 cases in 2015 to 404 cases in 2019. This is almost a 20% decrease in size. White victims have always been the largest portion of all victims of fatal police shooting, one might think that the white people are being discriminated on. So, does this drop in the White victim counts means a decrease in the racial disparity of the victims of fatal police shooting?
No. Upon closer examination of the demographic data of the United States, we notice that White people take up a much larger portion of the population than the other races. To make the comparison between races more meaningful, we normalize each race’s victim counts by the total population of that race in the United States. The result shows Native Americans are almost 3 times as likely to be shot by a police than Whites, following close after is African Americans at 2.5 times the likelihood to be shot than Whites.
-
Most victims of fatal police shootings are adult men
-
People of all ages and genders are being shot dead by police. But victims are particularly likely to be male between the age of 15-45. They have the physical characteristics to cause an uncertain fear to the police officers; therefore, they are more likely to be mis-identified as life threats.
-
Defund the police might not be the best solution
-
Defunding the police, in many people’s opinion is the best solution to this problem. It will hypothetically reduce fatal police shooting, but at what cost? Funding is necessary to keep a large number of policemen employeed. Fewer policemen should decrease the count of fatal police shootings, but would also increase crime rate and response time to crimes. Despite the occasional policemen who misjudge situations to pull the trigger, most policemen are employed to maintain peace in the neighborhood. Media rarely reports the success of policing doesn’t mean the police department has utterly failed. So, rushing to defund the police is an impulsive move that jeopardizes the safety of everyone in the neighborhood.
But, it has already been identified that some of the fatal police shootings are racially charged and many are results of misjudgements. What is a way to solve this issue without jeopardizing other people’s safety? An alternative solution is prioritizing police funding to programs that train policemen to treat people equally and follow the right protocol when dealing with complex situations. Implicit bias tests on race and gender may be used during recruiting procedures so that people with prejudice will not be selected into the law enforcement department? There are more solutions out there. This article is by no means claiming to have identified any well rounded solution.
Data Source
Link:
https://www.kaggle.com/mrmorj/data-police-shootings
https://www.kaggle.com/muonneutrino/us-census-demographic-data
License CC BY-SA 4.0